Geodata Visualization
Transforming complex geographical information into maps and visualizations that make spatial patterns, relationships, and distributions easier to examine and communicate.
British antiquarianism and the Levant
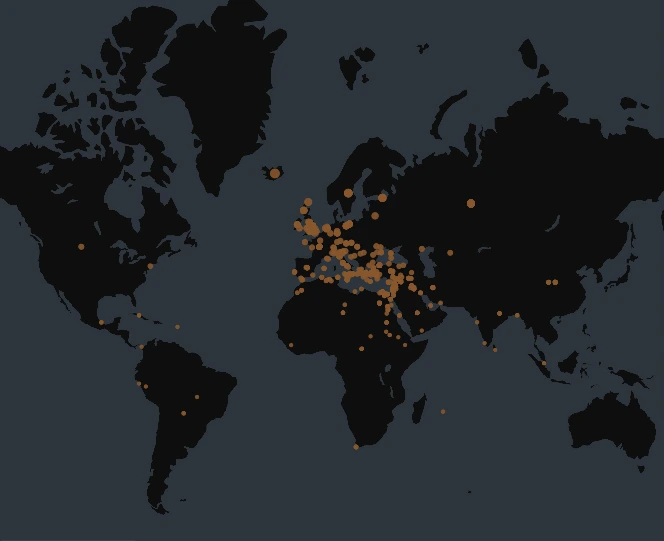
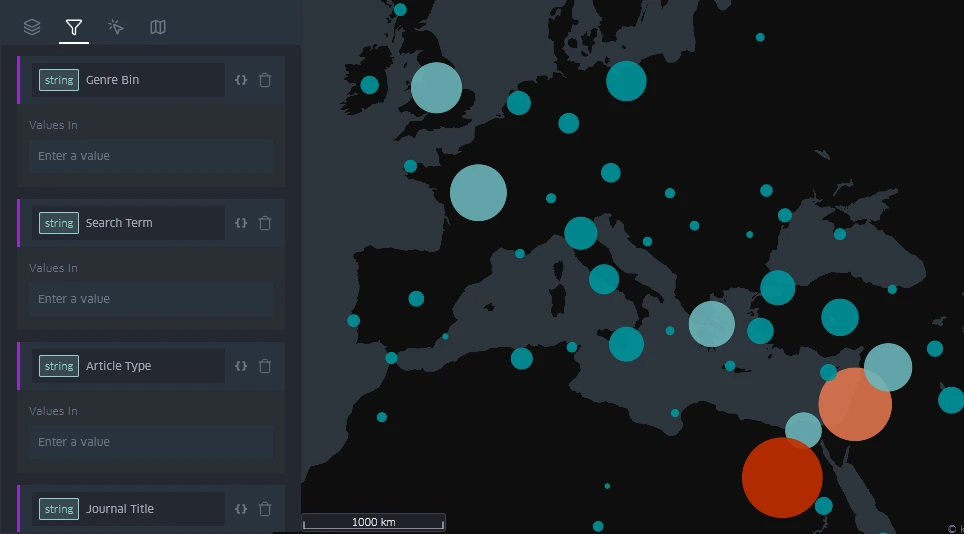
Spatial data connects information to places. Interactive views let us filter a corpus, compare periods, and examine patterns before deciding which findings need closer investigation. These views in Kepler.gl show places from Zoe Beenstock’s corpus of British references to the Levant. They offer different ways to examine the geographical distribution of the material.
 Enlarge image
 Enlarge image
Read about the research and database behind these views
Analysis and communication
Analytical visualization helps examine distributions, compare patterns, and test questions in the data. Publication cartography develops a considered visual argument for a specific page, presentation, or audience.
Depending on the material, the work may involve thematic mapping in GIS, interactive geographical views, or a designed map for publication. See examples of Designed Maps.